
Page 5 - MVEDA Annual Report
P. 5
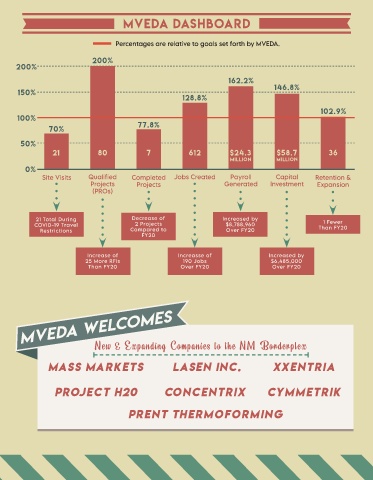
MVEDA Dashboard


                                        Percentages are relative to goals set forth by MVEDA.


                                200%
       200%

                                                                              162.2%
       150%                                                                                   146.8%
                                                               128.8%
                                                                                                             102.9%
       100%
                  70%                           77.8%

        50%
                   21             80               7             612           $24.3           $58.7            36
                                                                               Million        Million
          0%
               Site Visits     Qualified      Completed     Jobs Created       Payroll        Capital       Retention &
                                Projects       Projects                      Generated      Investment      Expansion
                                (PROs)


             21 Total During                  Decrease of                   Increased by                      1 Fewer
             COVID-19 Travel                   2 Projects                    $8,788,960                      Than FY20
               Restrictions                  Compared to                     Over FY20
                                                 FY20


                               Increase of                   Increasse of                   Increased by
                              25 More RFIs                     190 Jobs                      $6,485,000
                               Than FY20                      Over FY20                      Over FY20


        MVEDA WELCOMES


                                 New & Expanding Companies to the NM Borderplex


                 Mass Markets                              LaSen Inc.                        Xxentria


                   Project H20                           Concentrix                        Cymmetrik


                                            Prent Thermoforming